Версия для печати темы
Нажмите сюда для просмотра этой темы в обычном формате
Форум «Всё о Паскале» _ FAQ _ Занимательная графика
Автор: BlackShadow 21.05.2004 13:32
В этой теме приведены исходники, отрисовывающие следующие фигуры:
- "Архимедова спираль" (ниже в этом же сообщении)
Исходник для Турбо Паскаля (процедуры)
Исходник для Турбо Паскаля (ООП)
Отрисовка только прямыми линиями
Исходник для FPC

Фрактальные деревья- "Фигуры Лиссажу"
- Пример RGB графики в режиме 13h
Цитата
Параметрическое представление спирали: x = r cos t , y = r sin t, r = t/2
Если количество витков = n, то T пробегает от 0 до n*2*pi. r растёт от 0 до R_max (данный внешний радиус), и пропорционален T. Тогда r = T/(n*2*pi)*R_max.
Uses Graph, Crt;

Const
  r_max = 200;
  n = 7;
Var
  gr, gm: Integer;
  i, k: Integer;
  ZeroX, ZeroY: Integer;
  x, y, r, t: Double;

begin
  gr := Detect;

  InitGraph(gr, gm, '');
  k := n * 140;

  ZeroX := Round(GetMaxX/2);
  ZeroY := Round(GetMaxY/2);
  {MoveTo(ZeroX, ZeroY);}
  For i := 1 To k Do
    Begin
      T := (n * 2 * Pi) * i / k;
      r := T / (n * 2 * Pi) * r_max;
      x := r * Cos(T);
      y := r * Sin(T);
      PutPixel(ZeroX + Round(x), ZeroY - Round(y), White)
    End;
  ReadKey;
  CloseGraph;
end.
Автор: Romtek 16.07.2004 0:20
program Uzor;
Uses Graph, CRT;

Const
   m = 0.1;
   Max = 20;

type
   TPoint = record
     x,y: integer;
   end;

   TPolygon = Array [0..10] of TPoint;
Var
   Length,
   x0,y0   : word; { центр экрана, точка отсчёта }

procedure InitGr;
var gd,gm: integer;
begin
     gd := Detect;
     InitGraph (gd, gm, '..\bgi');
     if Graphresult <> 0 then
        Halt;
end;

{ Вращение объекта вокруг своей оси на Angle радиан}
procedure Rotate2D( var P: TPolygon; Angle: single);
var
   _cos,_sin: single;
   k: word;
   xx,yy: integer;
begin
     _cos := cos (Angle);
     _sin := sin (Angle);
     for k := 1 to P[0].x do
     with P[k] do
     begin
          xx := round (x * _cos + y * _sin);
          yy := round (y * _cos - x * _sin);
          { перевод в экранные координаты }
          x := x0 + xx;
          y := y0 - yy;
     end;
end;

{ построение фигуры }
procedure PlotFigure (P: TPolygon);
var
   k: word;
begin
     { установка позиции граф. курсора на 1-ю точку }
     MoveTo (P[1].X, P[1].Y);

     for k := 2 to P[0].X do
         { отрисовка линий от граф. курсора до точки }
         LineTo (P[k].X, P[k].Y);

     { отрисовка замыкающей линии }
     LineTo (P[1].X, P[1].Y);
end;

procedure PlotSquare (Length: word; phi: single);
var
   Polygon : TPolygon;

begin
     { так зададим кол-во сторон полигона  }
     Polygon[0].X := 4;

     { инициализация координат, относительно x0 и y0 }
     Polygon[1].X := -Length div 2;
     Polygon[1].Y := -Polygon[1].X;

     Polygon[2].X := Polygon[1].X + length;
     Polygon[2].Y := Polygon[1].Y;

     Polygon[3].X := Polygon[2].X;
     Polygon[3].Y := Polygon[1].Y - length;

     Polygon[4].X := Polygon[1].X;
     Polygon[4].Y := Polygon[3].Y;

     Rotate2D (Polygon, phi);
     PlotFigure (Polygon);
end;

var
   i: word;
   Coeff    : single;
   Alpha,
   Beta    : single;

begin
     Alpha  := Arctan (m / (1.0 - m));
     Beta   := 0.0;

     InitGr;

     x0 := GetMaxX div 2;
     y0 := GetMaxY div 2;

     { Длина стороны квадрата размером в полэкрана }
     Length := y0;

     { коэффициент уменьшения стороны квадрата }
     Coeff := M / sin (Alpha);

     for i := 1 to Max do
     begin
          { построить квадрат со стороной Length и поворотом Beta }
          PlotSquare (Length, Beta);

          { увеличить величину поворота на угол Alpha }
          Beta := Beta + Alpha;
          Length := round (Length * Coeff);
     end;

     repeat until keypressed;
     CloseGraph;
end.
Скачать исходник:
 source.pas ( 2.53 килобайт )
Кол-во скачиваний: 1892
source.pas ( 2.53 килобайт )
Кол-во скачиваний: 1892Эскизы прикрепленных изображений

Автор: Romtek 16.07.2004 10:59
Это код для FPC:
program Uzor;
Uses Windows, WinCRT,
     Graph;

Const
   m = 0.1;
   Max = 20;

type
   TPolygon = record
      Pol: Array [0..10] of PointType;
      Size: word;
   end;

Var
   Length,
   Color,
   x0,y0   : word;

procedure InitGr;
var gd,gm: smallint;
begin
     gd := Detect;
     InitGraph (gd, gm, '..\bgi');
     if Graphresult <> 0 then
        Halt;
end;

procedure Rotate2D( var P: TPolygon; Angle: single);
var
   _cos,_sin: single;
   k: word;
   xx,yy: integer;
begin
     _cos := cos (Angle);
     _sin := sin (Angle);
     for k := 0 to P.Size - 1 do
     with P.Pol[k] do
     begin
          xx := round (x * _cos + y * _sin);
          yy := round (y * _cos - x * _sin);
          x := x0 + xx;
          y := y0 - yy;
     end;
end;

procedure PlotFigure (P: TPolygon);
var
   k: word;
begin
     inc (Color);
     SetColor (Color);

     with P.Pol[0] do MoveTo (X, Y);

     for k := 1 to P.Size - 1 do
     with P.Pol[k] do LineTo (X, Y);

     with P.Pol[0] do LineTo (X, Y);

     FillPoly (P.Size, P.Pol);
end;

procedure PlotSquare (Length: word; phi: single);
var
   Polygon : TPolygon;

begin
     with Polygon do
     begin
          Size := 4;

          Pol[0].X := -Length div 2;
          Pol[0].Y := -Pol[0].X;

          Pol[1].X := Pol[0].X + length;
          Pol[1].Y := Pol[0].Y;

          Pol[2].X := Pol[1].X;
          Pol[2].Y := Pol[0].Y - length;

          Pol[3].X := Pol[0].X;
          Pol[3].Y := Pol[2].Y;
     end;

     Rotate2D (Polygon, phi);
     PlotFigure (Polygon);
end;

var
   i: word;
   Coeff    : single;
   Alpha,
   Beta    : single;

begin
     Alpha  := Arctan (m / (1.0 - m));
     Beta   := 0.0;

     ShowWindow (GetActiveWindow, 0);
     InitGr;

     Color := GetMaxColor div 4;

     x0 := GetMaxX div 2;
     y0 := GetMaxY div 2;

     Length := y0;
     Coeff := M / sin (Alpha);

     for i := 1 to Max do
     begin
          PlotSquare (Length, Beta);
          Beta += Alpha;
          Length := round (Length * Coeff);
     end;

     repeat until keypressed;
     CloseGraph;
end.
Скачать исходник:
source.pas ( 2.13 килобайт )
Кол-во скачиваний: 1424Эскизы прикрепленных изображений
Автор: volvo 5.11.2004 18:27
Можно задавать разное количество вершин и коэффициент...
{$N+}

Uses Graph;

Type
  TPoint =
    Record
      X, Y: Integer;
    End;

  PArrPoint = ^arrPoint;
  arrPoint =
    Array[1 .. maxInt Div SizeOf(TPoint)] Of TPoint;

  TFigure =
    Object
      nPoints: Byte;
      arr: PArrPoint;

      p: Integer;
      a: Double;

      Constructor Init(np: Integer;
        pVal: Integer; aVal: Double);
      Destructor Done;
      Procedure Run;

    Private
      Procedure InitPoints;

      Function Recalc: Boolean;
      Procedure Draw;
    End;

Constructor TFigure.Init(np: Integer;
            pVal: Integer; aVal: Double);
  Begin
    nPoints := np;
    a := aVal; p := pVal;
    GetMem(arr, nPoints * SizeOf(TPoint));

    InitPoints
  End;

Destructor TFigure.Done;
  Begin
    FreeMem(arr, nPoints * SizeOf(TPoint));
  End;

Procedure TFigure.InitPoints;

  Const
    RadToGrad = (180 / Pi);

  Procedure GetPoint(Var P: TPoint;
            Len: Integer; phi: Integer);
    Var fPhi: Double;
    Begin
      fPhi := phi / RadToGrad;
      P.X := (GetMaXX div 2) + Trunc(Len * Sin(fPhi));
      P.Y := (GetMaxY div 2) - Trunc(Len * Cos(fPhi));
    End;

  Var
    i, Len, phi: Integer;
    x: Double;
  Begin
    phi := 360 div nPoints;
    x := Cos(phi / RadToGrad);
    Len := Trunc(p / Sqrt(2* (1 - x)));

    For i := 1 To nPoints Do
      GetPoint(arr^[i], Len, Pred(i) * phi);
  End;

Function TFigure.Recalc: Boolean;
  Var
    T: PArrPoint;
    i, next: Integer;
  Begin
    GetMem(T, nPoints * SizeOf(TPoint));
    For i := 1 To nPoints Do
      Begin
        If i = nPoints Then next := 1 Else next := Succ(i);

        T^[i].x := Trunc((arr^[i].x + a*arr^[next].x) / (1 + a));
        T^[i].y := Trunc((arr^[i].y + a*arr^[next].y) / (1 + a));
      End;
    Recalc := (T^[1].x <> arr^[1].x);

    Move(T^, arr^, nPoints * SizeOf(TPoint));
    FreeMem(T, nPoints * SizeOf(TPoint))
  End;

Procedure TFigure.Draw;

  Procedure DrawLine( p1, p2: TPoint );
    Begin
      Line( p1.X, p1.Y, p2.X, p2.Y )
    End;

  Var
    i, next: Integer;
  Begin
    For i := 1 To nPoints Do
      Begin
        next := Succ(i);
        If i = nPoints Then next := 1;
        DrawLine( arr^[i], arr^[next] );
      End;
  End;


Procedure TFigure.Run;
  Begin
    Repeat
      Draw
    Until not ReCalc;
    ReadLn
  End;


Var
  f: TFigure;

  grDriver, grMode, ErrCode: Integer;
Begin
  grDriver := Detect;
  InitGraph(grDriver, grMode, '');
  ErrCode := GraphResult;
  If ErrCode <> grOk Then
    Begin
      WriteLn('Graphic Error: ', GraphErrorMsg(ErrCode));
      Halt(100)
    End;

  { 7 вершин, длина каждой стороны = 140, коэффициент = 0.05 }
  f.Init( 7, 140, 0.05 );
  f.Run;
  f.Done;

  CloseGraph;
End.
Скачать исходник:
poly.pas ( 2.75 килобайт )
Кол-во скачиваний: 1355Эскизы прикрепленных изображений

Автор: Altair 22.12.2004 22:19
Код
Uses crt,graph;
const
a=1.3; b=-1.3; c=-13; k1=2.1; k2=1;
x0=320; y0=240;
Var Gd,gm,sign:Integer;
x,y,old:real; i:longint;
begin
gd:=detect; initgraph(gd,gm,'');
x:=0; y:=0;
repeat
PutPixel(Round(x0+k1*x),Round(y0+k2*y), (i mod 6)+9);
if x<0 then sign:=-1 else sign:=1;
old:=y;
y:=a-x;
x:=old-sign*sqrt(abs(b*x-c));
inc(i);
until keypressed;
closegraph;
end.
Эскизы прикрепленных изображений
Автор: Altair 22.12.2004 22:24
Код
Uses crt, graph;
var
k:real;
gd,gm:Integer;
x,y,z:Longint;
Begin
gd:=detect; {gm:=VgaHi;} InitGraph(Gm,GD,'');
randomize;
k:=0.00000;
repeat
for x:=1 to getMaxX do
for y:=1 to GetMaxY do
begin
If keypressed then halt;
z:=sqr(x)+Sqr(y);{ 10+random(5);}
If odd(trunc(z*k)) then putpixel(x,y,15) else putpixel(x,y,7);
end;
k:=k+0.1;
until keypressed;
CloseGraph;
end.
Эскизы прикрепленных изображений
Автор: SHnur 11.01.2005 2:43
Програма, выводит на экран узор как в 1-ой программе выложенной здесь, но другим способом :
uses graph, crt;
var i , j , x :integer;
   graphdriver , GraphMode :integer;
   ch :boolean;
   col1 , col2 : integer;
begin
   GraphDriver := VGA;
   GraphMode := VGAHI;
   InitGraph(graphDriver,GraphMode,'e:\alexiv~1');
   COL1 := black;
   col2 := blue;

   ch := true;
   for j := 1 to 2 do begin
      if j = 1 then x := 0
      else x := 479;
      for i := 0 to 639 do begin
         line(319,239,i,x);
         ch := not(ch);
         case ch of
            true : setcolor(col1);
            false : setcolor(col2);
         end;
      end;
   end;

   for j := 1 to 2 do begin
      if j = 1 then x := 0
      else x := 639;
      for i := 0 to 479 do begin
         line(319,239,x,i);
         ch := not(ch);
         case ch of
            true : setcolor(col1);
            false : setcolor(col2);
         end;
      end;
   end;

   readkey;
 closegraph;
end.
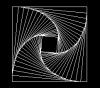
А самое интересное в нём - это то, если вы заметили, что он рисуется исключительно прямыми линиями.
Скачать исходник:
source.pas ( 916 байт )
Кол-во скачиваний: 1226Автор: SHnur 11.01.2005 2:47
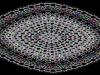
Вот небольшой код, рисующий так называемые "фигуры Лиссажу".
Можно побаловаться с коэфицентами: a1, a2, b1, b2, c1, c2...
program parametr;
uses graph , crt;
const a1 = 200; b1 = 1; c1 = 50;
      a2 = 200; b2 = 16;  c2 = 50;
var graphdriver , GraphMode :integer;
    i : integer;
    t , x ,y , x1 ,y1 , step:real;
begin
   GraphDriver := VGA;
   GraphMode := VGAHI;
   InitGraph(graphDriver,GraphMode,'x:\mypasc~1\IVSEM~1\');

   setviewport(320,240,639,479,clipoff);
   step := 0.0001;
   t:= step;

   moveto(round(a1 * sin((b1*t+c1))),round(a2 * cos((b2*t+c2))));
   t := 0;
   repeat
      t := t + step;
      x := a1 * sin((b1*t+c1));
      y := a2 * cos((b2*t+c2));
      delay(100);
      lineto(round(x),round(y));
   until (t >= 10) or keypressed;
   readln;
   closegraph;
end.
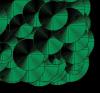
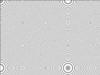
Автор: xds 11.01.2005 4:58
program Circles;

uses
  Crt, Graph;

const
  grDriver: Integer = VGA;
  grMode: Integer = VGAHI;

var
  x, y, r: Integer;

begin
  Randomize;
  InitGraph(grDriver, grMode, '');
  repeat
    x := Random(640);
    y := Random(480);
    for r := 0 to 30 + Random(50) do
      begin
        SetColor(2);
        Circle(x, y, r);
        SetColor(0);
        Circle(x + 1, y + 1, r);
      end;
  until KeyPressed;
  ReadKey;
  CloseGraph;
end.
Эскизы прикрепленных изображений

Автор: Dark 23.01.2005 6:52
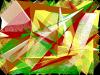
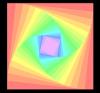
Очень интересный и красивый пример RGB графики на Паскале в режиме 13h.
Uses Crt;

CONST VGA=$a000;

Var Pall,Pall2 : Array[0..255,1..3] of Byte;

{--------------------------------------------------------------------------}
Procedure SetMCGA;  { This procedure gets you into 320x200x256 mode. }
BEGIN
  asm
     mov        ax,0013h
     int        10h
  end;
END;


{--------------------------------------------------------------------------}
Procedure SetText;  { This procedure returns you to text mode.  }
BEGIN
  asm
     mov        ax,0003h
     int        10h
  end;
END;


{--------------------------------------------------------------------------}
procedure WaitRetrace; assembler;

label
  l1, l2;
asm
    mov dx,3DAh
l1:
    in al,dx
    and al,08h
    jnz l1
l2:
    in al,dx
    and al,08h
    jz  l2
end;


{--------------------------------------------------------------------------}
Procedure GetPal(ColorNo : Byte; Var R,G,B : Byte);
Begin
   Port[$3c7] := ColorNo;
   R := Port[$3c9];
   G := Port[$3c9];
   B := Port[$3c9];
End;


{--------------------------------------------------------------------------}
Procedure Pal(ColorNo : Byte; R,G,B : Byte);
Begin
   Port[$3c8] := ColorNo;
   Port[$3c9] := R;
   Port[$3c9] := G;
   Port[$3c9] := B;
End;


{--------------------------------------------------------------------------}
Procedure Putpixel (X,Y : Integer; Col : Byte);
BEGIN
  Mem [VGA:X+(Y*320)]:=Col;
END;


{--------------------------------------------------------------------------}
Procedure line(a,b,c,d,col:integer);
   Function sgn(a:real):integer;
   BEGIN
        if a>0 then sgn:=+1;
        if a<0 then sgn:=-1;
        if a=0 then sgn:=0;
   END;
var u,s,v,d1x,d1y,d2x,d2y,m,n:real;
    i:integer;
BEGIN
     u:= c - a;
     v:= d - b;
     d1x:= SGN(u);
     d1y:= SGN(v);
     d2x:= SGN(u);
     d2y:= 0;
     m:= ABS(u);
     n := ABS(v);
     IF NOT (M>N) then
     BEGIN
          d2x := 0;
          d2y := SGN(v);
          m := ABS(v);
          n := ABS(u);
     END;
     s := INT(m / 2);
     FOR i := 0 TO round(m) DO
     BEGIN
          putpixel(a,b,col);
          s := s + n;
          IF not (s<m) THEN
          BEGIN
               s := s - m;
               a:= a +round(d1x);
               b := b + round(d1y);
          END
          ELSE
          BEGIN
               a := a + round(d2x);
               b := b + round(d2y);
          END;
     END;
END;


{--------------------------------------------------------------------------}
Procedure PalPlay;
Var Tmp : Array[1..3] of Byte;
  { This is used as a "temporary color" in our pallette }
    loop1 : Integer;
BEGIN
   Move(Pall[200],Tmp,3);
     { This copies color 200 from our virtual pallette to the Tmp variable }
   Move(Pall[0],Pall[1],200*3);
     { This moves the entire virtual pallette up one color }
   Move(Tmp,Pall[0],3);
     { This copies the Tmp variable to the bottom of the virtual pallette }
   WaitRetrace;
   For loop1:=1 to 255 do
     pal (loop1,pall[loop1,1],pall[loop1,2],pall[loop1,3]);
END;


{--------------------------------------------------------------------------}
Procedure SetUpScreen;
Var Loop : Integer;
BEGIN
   FillChar(Pall,SizeOf(Pall),0);
       { Clear the entire PALL variable to zero. }
   For Loop := 0 to 200 do BEGIN
      Pall[Loop,1] := Loop mod 64;
   END;
       { This sets colors 0 to 200 in the PALL variable to values between
         0 to 63. the MOD function gives you the remainder of a division,
         ie. 105 mod 10 = 5 }

   For Loop := 1 to 320 do BEGIN
      Line(319,199,320-Loop,0,(Loop Mod 199)+1);
      Line(0,0,Loop,199,(Loop Mod 199)+1);
       { These two lines start drawing lines from the left and the right
         hand sides of the screen, using colors 1 to 199. Look at these
         two lines and understand them. }
      PalPlay;
        { This calls the PalPlay procedure }
   END;
END;


{--------------------------------------------------------------------------}
Procedure GrabPallette;
VAR loop1:integer;
BEGIN
  For loop1:=0 to 255 do
    Getpal (loop1,pall2[loop1,1],pall2[loop1,2],pall2[loop1,3]);
END;


{--------------------------------------------------------------------------}
Procedure Blackout;
  { This procedure blackens the screen by setting the pallette values of
    all the colors to zero. }
VAR loop1:integer;
BEGIN
  WaitRetrace;
  For loop1:=0 to 255 do
    Pal (loop1,0,0,0);
END;


{--------------------------------------------------------------------------}
Procedure HiddenScreenSetup;
VAR loop1,loop2:integer;
BEGIN
  For loop1:=0 to 319 do
    For loop2:=0 to 199 do
      PutPixel (loop1,loop2,Random (256));
END;


{--------------------------------------------------------------------------}
Procedure Fadeup;
VAR loop1,loop2:integer;
    Tmp : Array [1..3] of byte;
      { This is temporary storage for the values of a color }
BEGIN
  For loop1:=1 to 64 do BEGIN
      { A color value for Red, green or blue is 0 to 63, so this loop only
        need be executed a maximum of 64 times }
    WaitRetrace;
    For loop2:=0 to 255 do BEGIN
      Getpal (loop2,Tmp[1],Tmp[2],Tmp[3]);
      If Tmp[1]<Pall2[loop2,1] then inc (Tmp[1]);
      If Tmp[2]<Pall2[loop2,2] then inc (Tmp[2]);
      If Tmp[3]<Pall2[loop2,3] then inc (Tmp[3]);
        { If the Red, Green or Blue values of color loop2 are less then they
          should be, increase them by one. }
      Pal (loop2,Tmp[1],Tmp[2],Tmp[3]);
        { Set the new, altered pallette color. }
    END;
  END;
END;


{--------------------------------------------------------------------------}
Procedure FadeDown;
VAR loop1,loop2:integer;
    Tmp : Array [1..3] of byte;
      { This is temporary storage for the values of a color }
BEGIN
  For loop1:=1 to 64 do BEGIN
    WaitRetrace;
    For loop2:=0 to 255 do BEGIN
      Getpal (loop2,Tmp[1],Tmp[2],Tmp[3]);
      If Tmp[1]>0 then dec (Tmp[1]);
      If Tmp[2]>0 then dec (Tmp[2]);
      If Tmp[3]>0 then dec (Tmp[3]);
        { If the Red, Green or Blue values of color loop2 are not yet zero,
          then, decrease them by one. }
      Pal (loop2,Tmp[1],Tmp[2],Tmp[3]);
        { Set the new, altered pallette color. }
    END;
  END;
END;


{--------------------------------------------------------------------------}
Procedure RestorePallette;
VAR loop1:integer;
BEGIN
  WaitRetrace;
  For loop1:=0 to 255 do
    pal (loop1,Pall2[loop1,1],Pall2[loop1,2],Pall2[loop1,3]);
END;


BEGIN
  SetMCGA;
  GrabPallette;
  SetUpScreen;
  repeat
     PalPlay;
       { Call the PalPlay procedure repeatedly until a key is pressed. }
  Until Keypressed;
  RestorePallette;
  SetText;
END.
Скачать исходник:
graph_13.pas ( 6.65 килобайт )
Кол-во скачиваний: 1423Автор: volvo 20.05.2005 9:48
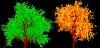
Фрактальные деревья
Uses Graph, CRT;
Procedure Tree(x, y: Integer; a: Real; l:integer);
Var
  x1, y1: Integer;
  p, s, i : Integer;
  a1    : Real;
Begin

  If l<8 Then exit;

  x1 := Round(x + l*cos(a));
  y1 := Round(y + l*sin(a));

  If l > 100 Then p:=100 Else p:=l;
  If p < 40 Then Begin
    { Генерировать листья }
    If Random > 0.5 Then SetColor(10) Else SetColor(2);   { или 4, 14 }
    For i:=0 To 3 Do Line(x+i, y, x1, y1)
  End
  Else Begin
    { Генерировать ветки }
    Setcolor(6);
    For i:=0 To (p div 6) Do Line(x+i-(p div 12), y, x1, y1);
  End;

  { Следующие ветки }
  For i:=0 To 9-Random(9) Do Begin
    s := Random(l-l div 6) + (l div 6);
    a1:= a + 1.6*(0.5-Random); { Угол наклона веток }
    x1:= Round(x + s*cos(a));
    y1:= Round(y + s*sin(a));
    Tree(x1, y1, a1, p-5-Random(30));
    { Чем меньше вычтем, тем пышнее будет дерево }
  End;
End;

Var
  gd, gm: Integer;
Begin
  Randomize;
  gd:=Detect;
  InitGraph(gd, gm, '');
  Tree(320, 480, 3*pi/2, 200);
  ReadKey;
  CloseGraph;
End.
Скачать исходник:
fractree.pas ( 1.11 килобайт )
Кол-во скачиваний: 2022Эскизы прикрепленных изображений
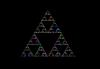
Автор: klem4 21.10.2007 20:00
Еще немного рекурсии  Салфетка Серпинского:
uses crt, graph;

var
  gd, gm: Integer;

procedure DrawTriangle(const bottomX, bottomY, size: Word);
var
  height: Word;
begin
  height := round(size * sqrt(3)) div 2;

  SetColor(Random(150) + 1);

  Line(bottomX, bottomY, bottomX - size div 2, bottomY - height);
  Line(bottomX, bottomY, bottomX + size div 2, bottomY - height);
  Line(bottomX - size div 2, bottomY - height, bottomX + size div 2, bottomY - height);

  delay(30);

end;

procedure Serpinsky(bottomX, bottomY, size, deep: Word);
var
  height: Word;
begin
  if deep > 0 then begin
    height := round(size * sqrt(3)) div 2;
    DrawTriangle(bottomX, bottomY, size);
    Serpinsky(bottomX - size div 2, bottomY, size div 2, deep - 1);
    Serpinsky(bottomX + size div 2, bottomY, size div 2, deep - 1);
    Serpinsky(bottomX, bottomY - height, size div 2, deep - 1);
  end;
end;

begin
  gd := Detect;
  InitGraph(gd, gm, '');

  Randomize;

  Serpinsky(GetMaxX div 2, GetMaxY div 2 + 150, 200, 6);

  readkey;
  CloseGraph;
end.
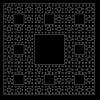
Автор: volvo 21.10.2007 20:42
Его же (в смысле, Серпинского) Ковер:
Uses CRT, Graph;
Var
   gd, gm: Integer;

procedure serp(x1, y1, x2, y2: real; n: integer);
var
  x1n, y1n, x2n, y2n: real;
begin
  if n > 0 then begin
    x1n:= 2*x1/3+x2 / 3;
    x2n:= x1/3+2*x2 / 3;
    y1n:= 2*y1/3+y2 / 3;
    y2n:= y1/3+2*y2 / 3;
    rectangle(round(x1n),round(y1n),round(x2n),round(y2n));
    serp(x1, y1, x1n, y1n, n-1);
    serp(x1n, y1, x2n, y1n, n-1);
    serp(x2n, y1, x2, y1n, n-1);
    serp(x1, y1n, x1n, y2n, n-1);
    serp(x2n, y1n, x2, y2n, n-1);
    serp(x1, y2n, x1n, y2, n-1);
    serp(x1n, y2n, x2n, y2, n-1);
    serp(x2n, y2n, x2, y2, n-1);
  end;
end;

Begin
  gd := detect;
  InitGraph(gd, gm, '');
  rectangle(20, 20, 460, 460);
  Serp(20, 20, 460, 460, 4);
  ReadLn;
  CloseGraph;
End.
Выглядит вот так:
Эскизы прикрепленных изображений
Автор: TarasBer 15.11.2007 23:08
Красивая анимация. Смысл прост: рисуется ломаная. Каждая вершина движется прямолинейно, отражаясь от стен. Ломаная всё время рисуется заново поверх старой.
Код
program Lines;
uses
Graph, CRT;
const
CountPoints = 30;
CountColors = 5;
Colors: array [0 .. CountColors - 1] of byte = (4, 2, 6, 14, 15);
var
i: integer;
GrDev, GrMode: integer;
X, Y: array [0 .. CountPoints - 1] of integer;
dx, dy: array [0 .. CountPoints - 1] of integer;
Col: array [0 .. CountPoints - 1] of byte;
begin
Randomize;
GrDev := VGA;
GrMode := VGAHi;
InitGraph(GrDev, GrMode, '');
for i := 0 to CountPoints - 1 do begin
X[i] := random(GetMaxX);
Y[i] := random(GetMaxY);
dx[i] := random(7) - 3;
dy[i] := random(7) - 3;
Col[i] := Colors[random(CountColors)];
end;
while KeyPressed do
ReadKey;
repeat
for i := 0 to CountPoints - 1 do begin
SetColor(Col[i]);
Line(X[i], Y[i],
X[(i + 1) mod CountPoints], Y[(i + 1) mod CountPoints]);
X[i] := X[i] + dx[i];
Y[i] := Y[i] + dy[i];
if (X[i] < 0) or (X[i] >= GetMaxX) then
dx[i] := -dx[i];
if (Y[i] < 0) or (Y[i] >= GetMaxY) then
dy[i] := -dy[i];
end;
until KeyPressed;
CloseGraph;
end.
Картинка:
Эскизы прикрепленных изображений